In Formula 1, tire strategy is one of the most critical yet least visible aspects of race performance. Choosing the right compound, pit window, and response to changing track conditions can make or break a team’s result. With factors like weather, track degradation, and safety cars all influencing decisions in real time, strategy calls are made under intense pressure and uncertainty.
F1 teams rely on millions of data points each lap to assist them in this process. But to outsiders who don’t have access to this information, tire strategies can seem a bit like a black box. To fix this, I tried breaking down the problem into the following question:
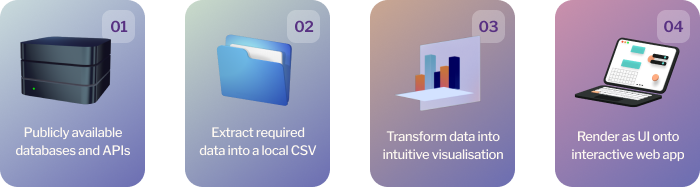
Data architecture: Chose to locally store a CSV file over Fast F1 API calls to maximise rendering speeds and eliminate reliance on third-party infrastructure.
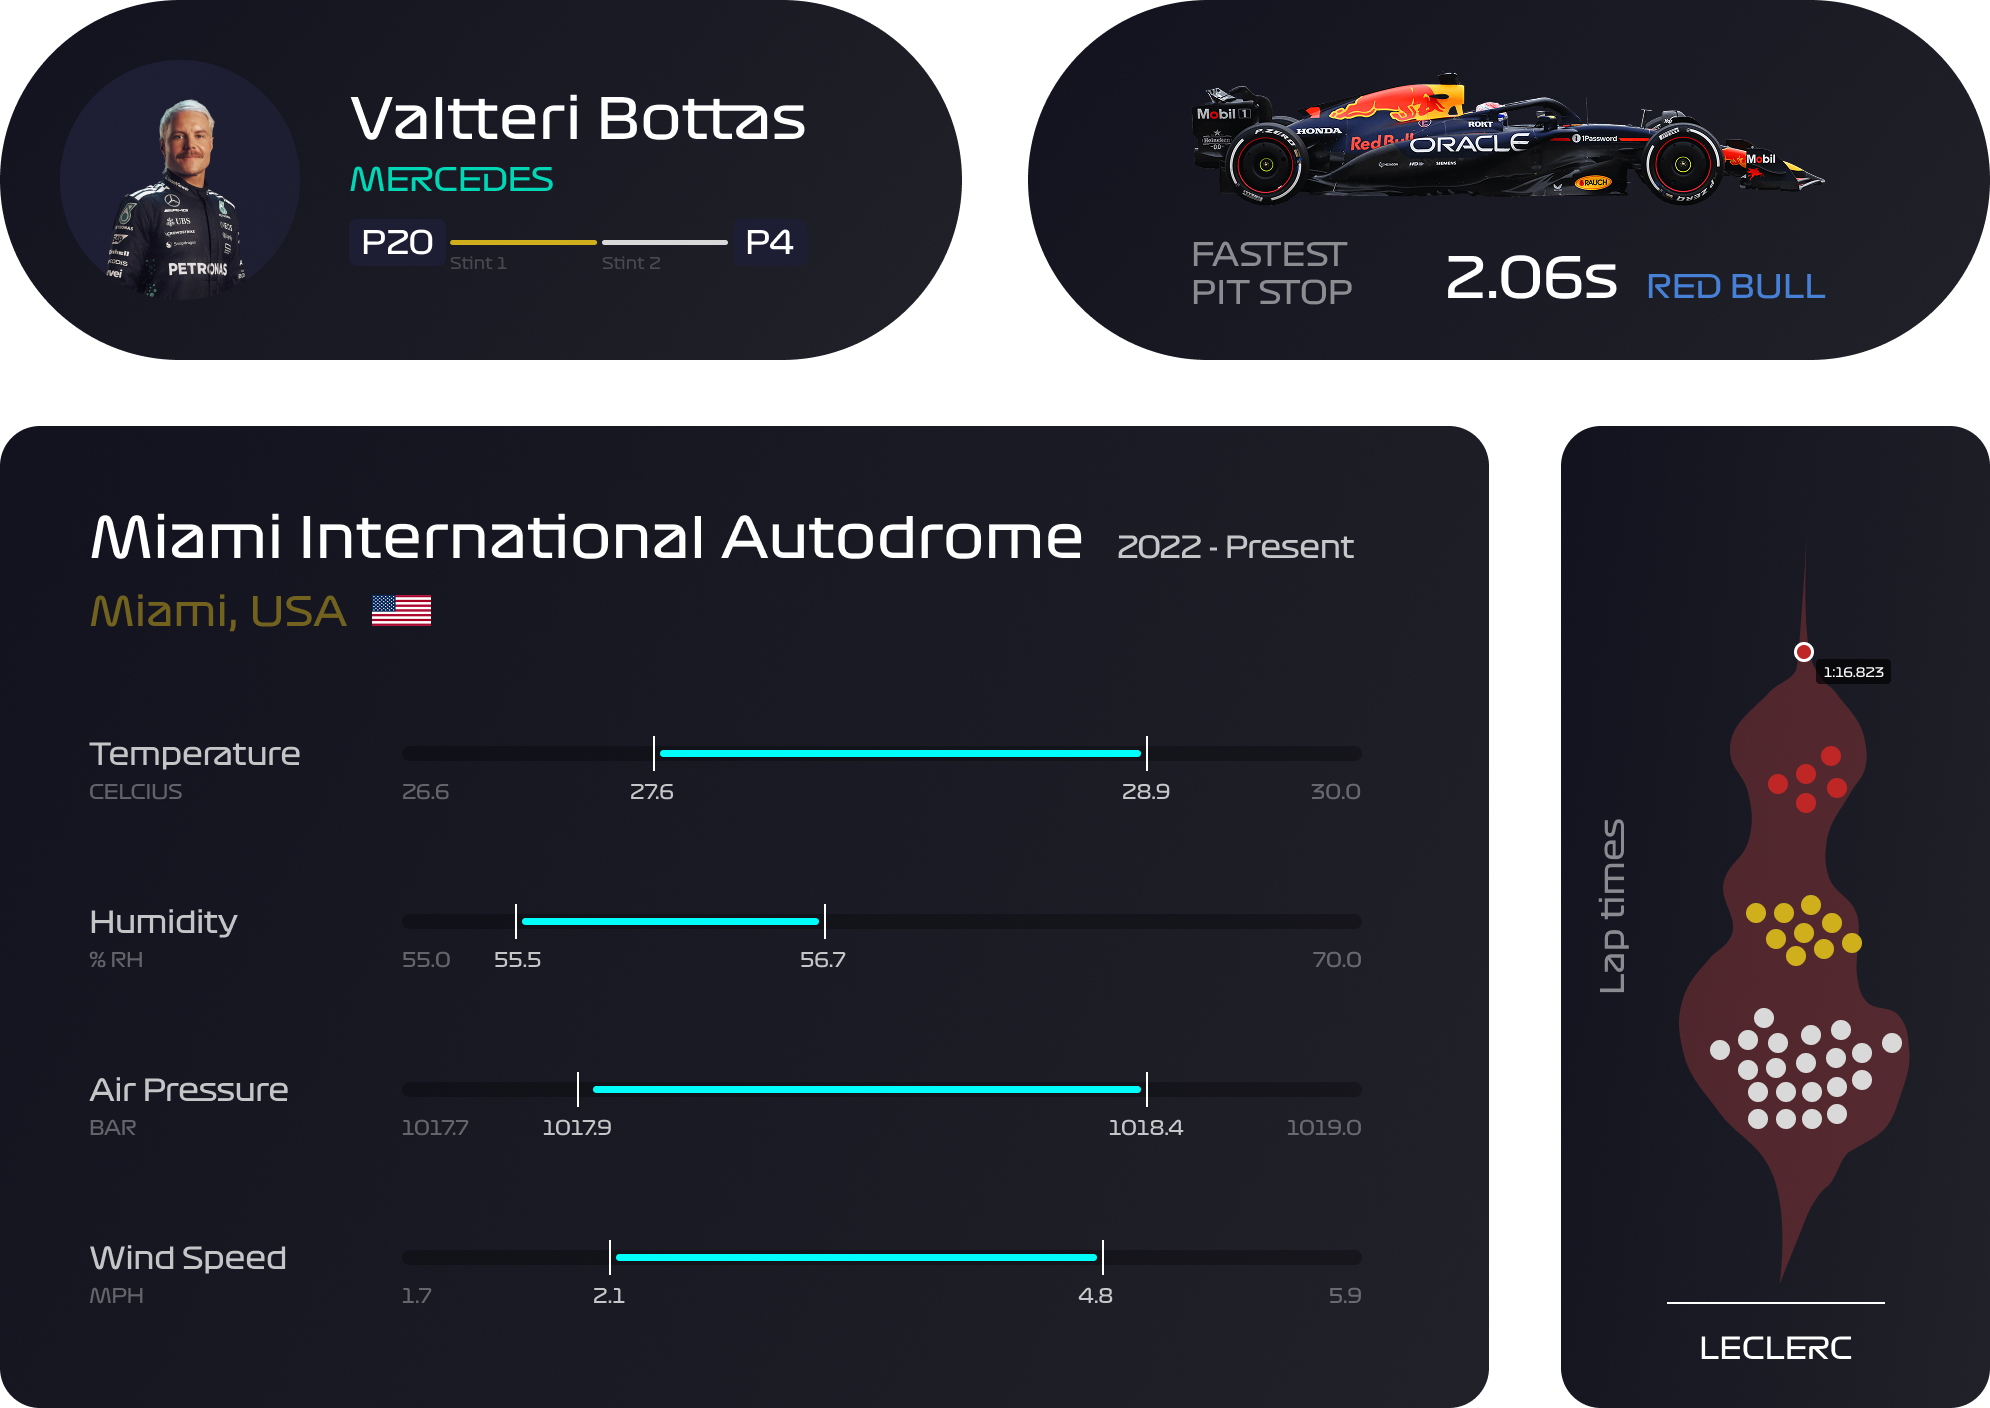
UI choices: Stacked bar charts effectively visualised the part-to-whole relationship between tire stints across an entire race.
UX logic: F1 races follow a temporal-first mental model, where races are listed as ‘2024 Spanish Grand Prix’ rather than the other way round. This influenced filter placement to enhance usability clarity.
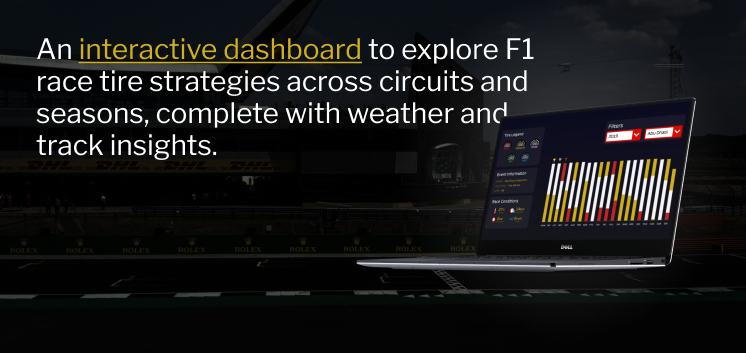
The result is a fully interactive dashboard that empowers users to explore how F1 tire strategies unfold across seasons and circuits. Users can filter by year and Grand Prix to load a stacked bar graph visualizing each driver’s stint strategy, complete with weather conditions, and circuit metadata.
Each component in the interface was purpose-built to deliver information with clarity, precision, and visual hierarchy. Data from the CSV backend was normalized and parsed into structured formats that allowed each UI element to dynamically reflect race-specific context. Key areas of focus for me were microinteractions, responsive behavior, and visualisation suitability.
This project brought together my interests in motorsport, data storytelling, and interaction design to solve a niche but meaningful problem: making tire strategy in F1 more understandable and explorable. By visualizing tire stints across circuits and seasons, this dashboard: